4TB RAM, Yet an OOM Error? Debugging a Spark Memory Mystery
Everything seemed right—ample resources, a well-sized cluster, and yet, the Spark job kept failing with an out-of-memory error. Logs pointed to memory allocation failures, but with a 63-node cluster, each equipped with 64GB RAM, this shouldn’t have been an issue. We tweaked configurations, analyzed logs, and even considered scaling up the cluster. But the real solution? It wasn’t what we expected.
The Data Challenge
Our task involved processing three datasets:
- A primary dataset weighing in at 450GB
- Two supplementary datasets of 5GB and 3GB respectively
Our Infrastructure:
- A robust cluster of 63 worker nodes
- Each node packed with 8 CPU cores and 64GB RAM
- Single executor per node, totaling 63 executors cluster-wide
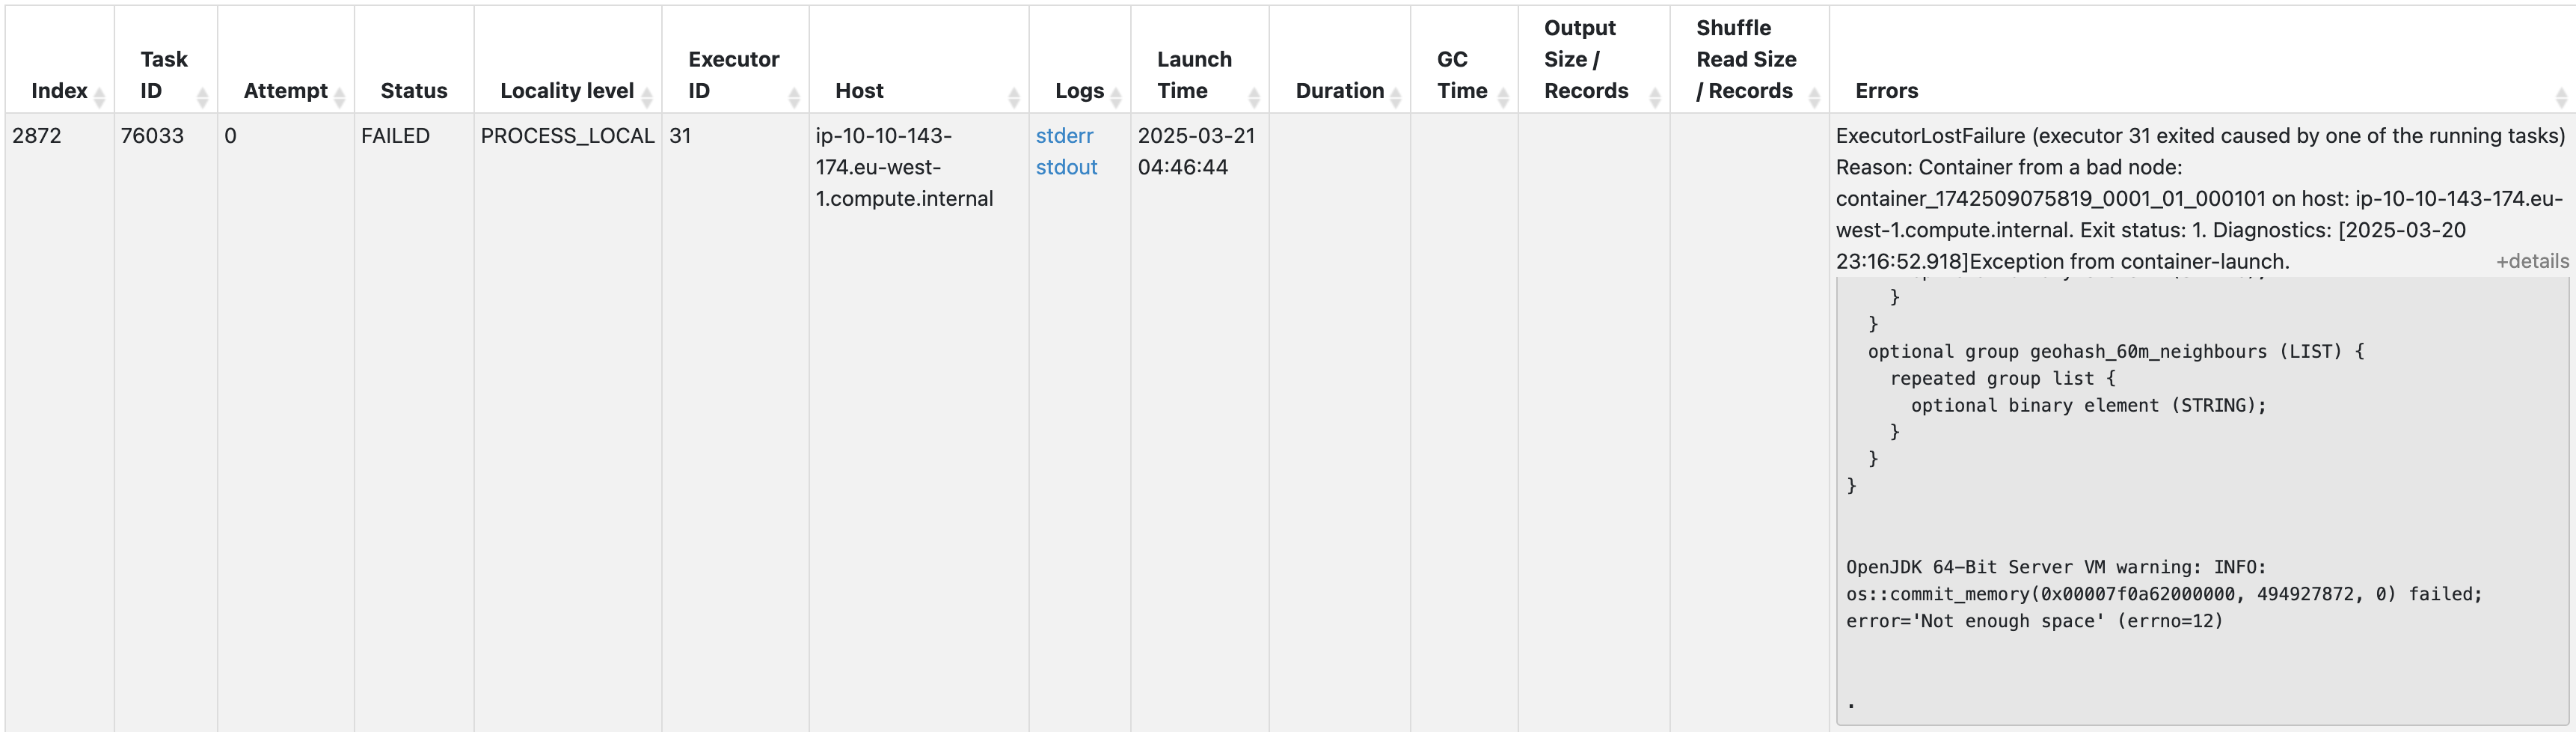
The job failed with this error:
OpenJDK 64-Bit Server VM warning: INFO: os::commit_memory(0x00007f0a62000000, 494927872, 0) failed; error='Not enough space' (errno=12)
At first glance, this error made little sense. Our cluster had plenty of RAM, yet the JVM couldn’t allocate memory properly. The failure suggested that the issue wasn’t a lack of overall memory, but rather how memory was being allocated within the executors.
Our first instinct? Increase the cluster size. But was that really the right approach?
Debugging Process: What Went Wrong?
-
Initial Assumption: Not Enough Resources
At first, we assumed our cluster was too small. More nodes mean more memory, right? But with 63 nodes and a total of 4TB RAM, this didn’t add up. Something else was at play.
-
Heap Allocation Problems
Each executor was given 64GB heap. While this seems like a good idea (more memory per executor), it actually led to heap inefficiencies:
- Large heaps increase fragmentation.
- Memory allocation within a single executor becomes harder for the OS.
- Longer GC pauses, slowing down the job.
-
JVM Garbage Collection (GC) Bottlenecks
Garbage collection should ideally free up unused memory quickly. However, with a large heap size, we observed:
- Major GC pauses due to excessive memory usage.
- Inefficient cleanup cycles, causing out-of-memory errors.
- We tried tuning GC with:
-verbose:gc -XX:+PrintGCDetails -XX:+PrintGCDateStamps -XX:OnOutOfMemoryError='kill -9 %p'
-XX:+UseG1GC -XX:InitiatingHeapOccupancyPercent=30
But the job still failed.
The Fix: More Executors, Smaller Heaps
Instead of increasing the cluster size, we changed:
- 63 executors → 252 executors
- Each executor now had 2 CPU, 16GB RAM (instead of 8 CPU, 64GB RAM)
Result? The job passed. ✅
Why This Worked
-
Smaller Containers, Better Efficiency
JVM memory management becomes inefficient with extremely large heap sizes. By reducing the heap size from 64GB to 16GB, memory allocation became more efficient and predictable.
-
Improved Garbage Collection (GC)
- Large heaps cause longer GC pauses, delaying memory cleanup.
- Smaller heaps = shorter GC pauses = better performance.
- With more executors, GC cycles ran faster and in parallel.
-
Better Load Distribution
- Before: Some nodes were underutilized, while others struggled.
- After: More executors meant better workload balance.
Benchmarking: Before vs. After
| Configuration | Executors | Heap Size per Executor | GC Pause Time | Job Status |
|---|---|---|---|---|
| Before | 63 | 64GB | Long | ❌ Failed |
| After | 252 | 16GB | Short | ✅ Passed |
Although runtime remained the same, memory stability improved significantly.
Key Takeaways
- Bigger heap ≠ better performance. JVM works better with moderate heap sizes.
- More, smaller executors prevent memory fragmentation & GC issues.
- Before adding more hardware, tweak executor count & memory settings.
- If you see memory errors despite having enough RAM, rethink heap size!
Next time you face a Spark memory issue, don’t just scale up the cluster—try optimizing executors first. It might save you a lot of headaches (and money)! 🚀
Lastly, thank you for reading this post. For more awesome posts, you can explore my other articles here, and follow me on Github — amarlearning.
#apache-spark #spark #big data #data-processing #performance #performance-optimization #distributed-computing #data engineering